Archive for June, 2007

Flood June 2007

The week the UK has suffered floods that are expected to cost insurance companies over £1 billion.  Many people have been evacuated from their homes and yet still there is more rain expected. 

But why have we had so much rain in June?  

The reason for this excess of rain is that the polar jet which steers our weather system is stuck further south than is usual for this time of year, so we are more open to low pressures.  Last week we saw intense thunderstorms, and on Monday a low-pressure weather front sat above the same parts of the country. As a result, a month’s worth of rain fell in 24 hours in some parts of the country.


Ulley Reservoir Environmental Agency flood potential map

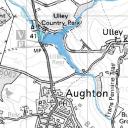
 This map is from the environmental agency and shows the potential flood risk for the Ulley reservoir.  This week engineers have been battling to stop this reservoir from bursting its banks.  This has been successful however the pumped out water has resulted in other areas being flooded and many people have had to be evacuated.  Click on the google earth link below to open this map in google earth.

google_earth_link.gif click to open up a google earth file which will automatically download placemarks with flooding photos and overlay of flood zones from the environmental agency for the South Yorkshire area.

Some more links to video’s from Look North.

Look North Special on the floods

Bentley residents rescued

Heavy Rain Predicted this weekend

The Met office has issued a severe weather warning for the weekend of  23rd and 24th of July.

This is the latest weather warnings (these update automatically each day)


Click here for the latest satellite image of the UK

This is a powerpoint of the effects from Andy Pinks a geography teacher in Cambridge.  Thanks Andy.

Google Earth Activity:Map Skills Revision

waltshaw-dean.jpg 

  Click on this Google Earth file to download a map of Walshaw Dean Reservoir and some map tacks that will ask you questions.  You must have Google Earth installed on your computer. 

In order to answer the questions right click on each one and then go to properties.  You can then write in the answer and save the file and send it to me via the shared network.  This is to help you revise your six figure grid references, contours, direction and measuring distance.

Act on CO2 but what about China?

Today a new calculator to find out what your carbon footprint is has been launched.  Click the picture above to have a go. You will find out your footprint and get a personalised action plan to help you reduce your footprint.

BUT WHAT ABOUT CHINA?

Also today it has been announced that China is building on average 2 new power stations per week.  (BBC Article here).  You may ask yourself how can switching off all my lights and doing the small bit I do help when China is emitting vast quantities of CO2 into the atmosphere?  The answer is that we have exported our carbon emissions to China,  China are producing goods for the western markets and as the West was developing it didn’t have to worry about the emissions as no one understood the implications.  Perhaps we should look at ways to help China reduce emissions rather than blaming them and still continue with our efforts to reduce our own footprints.

Y7 Where the Hell is Matt?

Watch the video below and then find all the places from the worksheet and locate them using Google Earth.  You will need to put map pins into and write a description of the place Matt visited.  Watch the video carefully to describe the places.  If you have any other knowledge of any of these places then include this in your description also. 

When all the places have been located using the map pins then draw on the route and measure the distance that Matt travelled.  Remember the order on the worksheet and the video is not necessarily the order he visited the sites so think about a logical route that would be the quickest and cost the least amount of money.

 Click here to download the worksheet to go with this lesson.

  Click here to download the google earth files showing Matt’s journey.  It should ask you to open it or save it.  Just save it to your computer and then open it.  If you have google earth installed it should open automatically.

This has been adapted from an idea that was originally from Richard Allaway’s brilliant site geography all the way.  Thanks Richard (See blogroll)

Year 10 GCSE Web Cam

Piccadilly Circus London – What is the function?

Above is a web cam.  If you refresh your browser you will be able to refresh the image.  This is a hint at what we will be studying this week.

What are Year 10 trying to demonstrate?

This photo was taken on our recent field trip to Loughton Brook. This was the year 10’s idea to explain a particular landform. Can you guess what they are trying to explain? Some of the other photos from the trip can be viewed at the flickr site just click on the side bar to view more.

What process are we trying to show?

What process are they trying to show?

What is this landform?

What is this Landform

Y9 Geography of Fashion

Year 9 last term were working on the Geography of fashion last term before they started their GCSE course yesterday.  Here are some of their findings about the global fashion industry.

Tania researched Primark

Claire and Courtney looked at the NBA (Basketball)

Rachel (Not sure who else worked with you please let me know) researched Gap

These were just a few of the many entries from Y9.  Well done and good luck with your new courses this term.

Year 10 Introduction to Settlement

Today was the start of the Year 10 GCSE course as Year 9 have now become year 10 over the half term!   

Welcome to all who have started their GCSE Geography course today. The course you will be following is the AQA A syllabus click here to find out more about the syllabus This is a different syllabus to the one year 11 have been doing.  That was the Avery Hill Syllabus,   Good luck to all the Geographers who sat this exam today.

I have decided to post your first lesson on the main part of the blog. The pages in the GCSE section all have the vocab you need to know for each unit we will be studying. We will be starting with Settlement and this will take us up to the end of the term. I have added settlement vocab already but I will be adding definitions to this list in the future. Make sure you know all of your definitions.

This powerpoint will help you with some ideas for your homework and covers all the factors we covered in class today.

Homework: Finish the mind map showing factors of location for a site. Use all the information above to add to this map. Don’t forget to draw your pictures to help you use the above powerpoint to help you.


Add to Technorati Favorites

Gorgeous Geography Calendar

June 2007
M T W T F S S
 123
45678910
11121314151617
18192021222324
252627282930  

Blog Stats

  • 452,585
Geo Visitors Map

Ms Richards Flickr Photos

Weather Pixie

The WeatherPixie